创建Unit File
[root@ceph-mon01 local]# cat /usr/lib/systemd/system/node_exporter.service[Unit]Description=Prometheus exporter for machine metrics, written in Go with pluggable metric collectors.Documentation=https://github.com/prometheus/node_exporterAfter=network.target[Service]EnvironmentFile=-/etc/sysconfig/node_exporterUser=prometheusExecStart=/usr/local/node_exporter/node_exporter \$NODE_EXPORTER_OPTSRestart=on-failureStartLimitInterval=1RestartSec=3[Install]WantedBy=multi-user.target[root@ceph-mon01 local]#启动node_exporter
[root@ceph-mon01 local]# systemctl daemon-reload[root@ceph-mon01 local]# systemctl start node_exporter[root@ceph-mon01 local]# systemctl status node_exporter.service● node_exporter.service - Prometheus exporter for machine metrics, written in Go with pluggable metric collectors.Loaded: loaded (/usr/lib/systemd/system/node_exporter.service; disabled; vendor preset: disabled)Active: active (running) since Sun 2022-10-09 21:58:12 CST; 6s agoDocs: https://github.com/prometheus/node_exporter Main PID: 3247 (node_exporter)CGroup: /system.slice/node_exporter.service└─3247 /usr/local/node_exporter/node_exporterOct 09 21:58:12 ceph-mon01.ilinux.io node_exporter[3247]: ts=2022-10-09T13:58:12.121Z caller=node_exporter.go:115 level...zoneOct 09 21:58:12 ceph-mon01.ilinux.io node_exporter[3247]: ts=2022-10-09T13:58:12.121Z caller=node_exporter.go:115 level...timeOct 09 21:58:12 ceph-mon01.ilinux.io node_exporter[3247]: ts=2022-10-09T13:58:12.121Z caller=node_exporter.go:115 level...imexOct 09 21:58:12 ceph-mon01.ilinux.io node_exporter[3247]: ts=2022-10-09T13:58:12.121Z caller=node_exporter.go:115 level...euesOct 09 21:58:12 ceph-mon01.ilinux.io node_exporter[3247]: ts=2022-10-09T13:58:12.121Z caller=node_exporter.go:115 level...nameOct 09 21:58:12 ceph-mon01.ilinux.io node_exporter[3247]: ts=2022-10-09T13:58:12.121Z caller=node_exporter.go:115 level...statOct 09 21:58:12 ceph-mon01.ilinux.io node_exporter[3247]: ts=2022-10-09T13:58:12.121Z caller=node_exporter.go:115 level...=xfsOct 09 21:58:12 ceph-mon01.ilinux.io node_exporter[3247]: ts=2022-10-09T13:58:12.121Z caller=node_exporter.go:115 level...=zfsOct 09 21:58:12 ceph-mon01.ilinux.io node_exporter[3247]: ts=2022-10-09T13:58:12.121Z caller=node_exporter.go:199 level...9100Oct 09 21:58:12 ceph-mon01.ilinux.io node_exporter[3247]: ts=2022-10-09T13:58:12.121Z caller=tls_config.go:195 level=in...alseHint: Some lines were ellipsized, use -l to show in full.[root@ceph-mon01 local]# ss -tnlStateRecv-Q Send-QLocal Address:PortPeer Address:PortLISTEN0128172.16.30.71:6803*:*LISTEN0128192.168.0.71:6803*:*LISTEN0128192.168.0.71:6804*:*LISTEN0128*:22*:*LISTEN0128*:7480*:*LISTEN0100127.0.0.1:25*:*LISTEN05*:8443*:*LISTEN0128192.168.0.71:6789*:*LISTEN0128172.16.30.71:6800*:*LISTEN0128192.168.0.71:6800*:*LISTEN0128172.16.30.71:6801*:*LISTEN0128192.168.0.71:6801*:*LISTEN0128172.16.30.71:6802*:*LISTEN0128192.168.0.71:6802*:*LISTEN0128[::]:22[::]:*LISTEN0100[::1]:25[::]:*LISTEN0128[::]:9100[::]:*[root@ceph-mon01 local]#提示:node_exporter默认监听在tcp的9100,通过这个端口加/metrics可以输出对应采集到的指标数据;
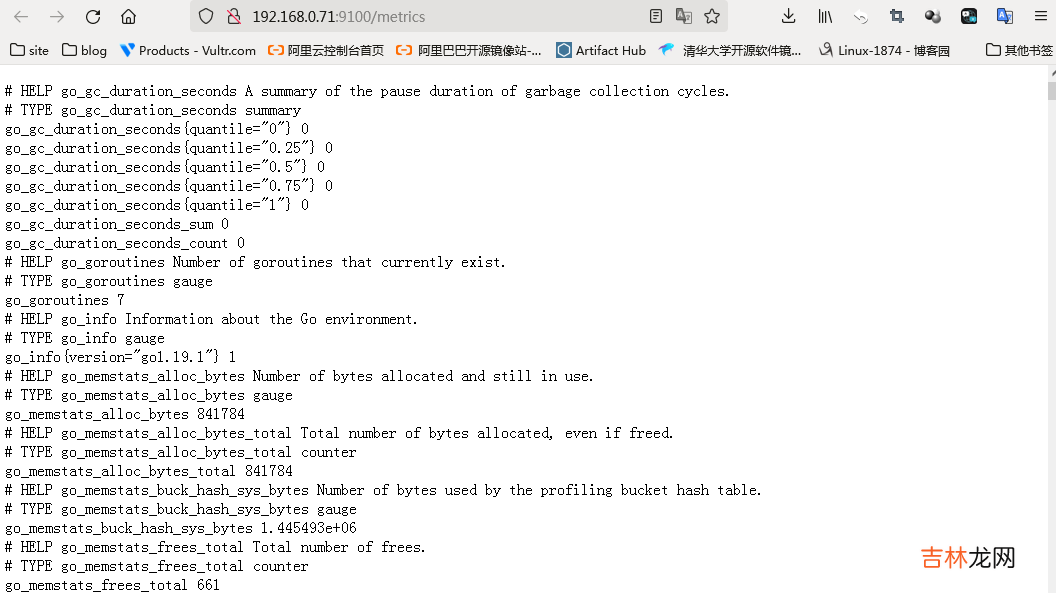
验证,访问ceph-mon01的9100,看看对应指标数据是否采集到了?
文章插图
提示:可以看到访问192.168.0.71:9100/metrics能够输出很多指标数据,说明node_exproter部署没有问题;
将node_exporter的指标数据导入Prometheus server
在导入node_exporter的指标数据之前,我们先来了解下Prometheus 配置文件
[root@ceph-mgr02 prometheus]# cat prometheus.yml# my global configglobal:scrape_interval: 15s # Set the scrape interval to every 15 seconds. Default is every 1 minute.evaluation_interval: 15s # Evaluate rules every 15 seconds. The default is every 1 minute.# scrape_timeout is set to the global default (10s).# Alertmanager configurationalerting:alertmanagers:- static_configs:- targets:# - alertmanager:9093# Load rules once and periodically evaluate them according to the global 'evaluation_interval'.rule_files:# - "first_rules.yml"# - "second_rules.yml"# A scrape configuration containing exactly one endpoint to scrape:# Here it's Prometheus itself.scrape_configs:# The job name is added as a label `job=<job_name>` to any timeseries scraped from this config.- job_name: "prometheus"# metrics_path defaults to '/metrics'# scheme defaults to 'http'.static_configs:- targets: ["localhost:9090"][root@ceph-mgr02 prometheus]#
经验总结扩展阅读


- 全国公安网查询系统-公安部户籍查询系统
- 图书馆的超星阅览室怎么免费下载电子书 超星校园阅读系统
- 分布式存储系统之Ceph集群RadosGW基础使用
- 记一次某制造业ERP系统 CPU打爆事故分析
- 没有使用IaC的DevOps系统都是耍流氓
- JuiceFS 元数据引擎选型指南
- 怎么用u盘重装系统
- 分布式存储系统之Ceph集群MDS扩展
- 苹果手机怎么删除系统软件
- win7升级到win10系统后,node13升级为node16,node版本node-sass版本与不匹配,导致出现npm ERR! ERESOLVE could not resolve