文章插图
使用seaborn的优点有:1.seaborn默认浅灰色背景与白色网格线的灵感来源于Matplotlib,却比matplotlib的颜色更加柔和;2.seaborn把绘图风格参数与数据参数分开设置 。seaborn有两组函数对风格进行控制:axes_style()/set_style()函数和plotting_context()/set_context()函数 。axes_style()函数和plotting_context()函数返回参数字典,set_style()函数和set_context()函数设置Matplotlib 。
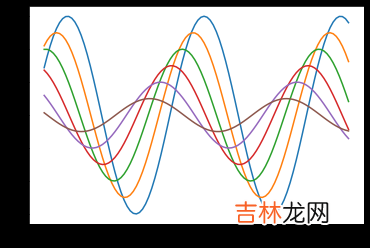
(1)使用set_style()函数具体通过cording查看效果:
import seaborn as snssns.set_style("ticks")sns.set_style("whitegrid")sinplot()plt.show()#seaborn 有5种预定义的主题:#darkgrid (灰色背景+白网格)#whitegrid(白色背景+黑网格)#dark (仅灰色背景)#white (仅白色背景)#ticks (坐标轴带刻度)#默认的主题是darkgrid,修改主题可以使用set_style()函数

文章插图
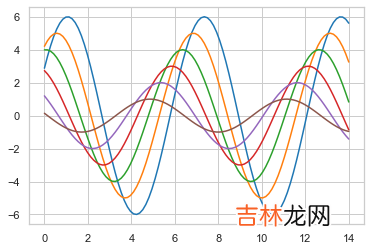
(2)使用set_context()函数具体通过coding查看效果:
import seaborn as snssns.set_context("paper")sinplot()plt.show()#上下文(context)可以设置输出图片的大小尺寸(scale)#seaborn中预定义的上下文有4种:paper、notebook、talk和poster 。 默认使用notebook上下文
文章插图
(3)使用Seaborn“耍酷”然而seaborn 不仅能够用来更改背景颜色,或者改变画布大小,还有其他很多方面的用途,比如下面这个例子:
import seaborn as snssns.set()#通过加载sns自带数据库中的数据(具体数据可以不关心)flights_long = sns.load_dataset("flights")flights = flights_long.pivot("month","year","passengers")#使用每个单元格中的数据值绘制一个热图heatmapsns.heatmap(flights,annot=True,fmt="d",linewidths=.5)plt.show()

文章插图
4.描述性统计图形概览描述性统计是借助图表或者总结性的数值来描述数据的统计手段 。数据挖掘工作的数据分析阶段,我们可借助描述性统计来描述或总结数据的基本情况,一来可以梳理自己的思维,二来可以更好地向他人展示数据分析结果 。数值分析的过程中,我们往往要计算出数据的统计特征,用来做科学计算的Numpy和SciPy工具可以满足我们的需求 。Matplotlib工具可用来绘制图,满足图分析的需求 。
4.1制作数据数据是自己制作的,主要包括个人身高、体重及一年的借阅图书量(之所以自己制作数据是因为不是每份真实的数据都可以进行接下来的分析,比如有些数据就不能绘制饼图,另一个角度也说明,此处举例的数据其实没有实际意义,只是为了分析而举例,但是不代表在具体的应用中这些分析不能发挥作用) 。另外,以下的数据显示都是在Seaborn库的作用下体现的效果 。
#案例分析(结合图书情报学,比如借书量)from numpy import arrayfrom numpy.random import normaldef getData(): heights = [] weights = [] books = [] N =10000 for i in range(N): while True: #身高服从均值为172,标准差为6的正态分布 height = normal(172,6) if 0<height:break while True: #体重由身高作为自变量的线性回归模型产生,误差服从标准正态分布 weight = (height-80)*0.7 + normal(0,1) if 0 < weight:break while True: #借阅量服从均值为20,标准差为5的正态分布 number = normal(20,5) if 0<= number and number<=50: book = "E"if number <10 else("D"if number<15 else ("C"if number<20 else("B"if number<25 else "A"))) break heights.append(height) weights.append(weight) books.append(book) return array(heights),array(weights),array(books) heights,weights,books =getData()
经验总结扩展阅读


- 柔纱帘与百叶窗哪个好
- 农夫与蛇文章讲了什么
- 毛巾用几天变一块块黄
- 总裁与ceo有什么区别
- 孙坚孙策孙权是什么关系
- 创造与魔法10月26日礼包兑换码是什么
- 设计与制造之间有怎样的联系
- 皂荚树与皂角树哪个是洗衣服
- 洒脱的近义词与反义词
- 如何找到骑马与砍杀的存档