文章插图
上面提到的修改可以通过代码轻松更改 。SpreadJS 提供了许多不同的选项来根据应用程序的需要自定义数据透视表的外观和功能 。我们可以更改数据透视表选项和布局,如下所示:
let option = pivotTable.options;option = {allowMultipleFiltersPerField: true,insertBlankLineAfterEachItem: true, // Insert Blank Line after Each Item *grandTotalPosition: GC.Spread.Pivot.GrandTotalPosition.row,subtotalsPosition: GC.Spread.Pivot.SubTotalsPosition.top, // Show SubTotals at the Top of the Group *displayFieldsInPageFilterArea: GC.Spread.Pivot.DisplayFields.downThenOver,reportFilterFieldsPerColumn: 1,bandRows:true,bandColumns: true,showRowHeader: true,showColumnHeader: true,showDrill: true, // Collapse Buttons *showMissing: true,showToolTip: true,missingCaption: 'something',fillDownLabels: false,repeatAllItemLabels: false,rowLabelIndent: 4,mergeItem: false,showHeaders: true // Collapse Field Headers *};pivotTable.layoutType(1); // Change the Pivot Layout to Outline Form *条件和自定义格式接下来,将格式化数据透视表字段 。这里可以使用如下所示的数据透视面板设置格式:
- 转到值 - > 值字段设置
- 单击数字格式
- 设置格式 。在我们的例子中:$#,##0
- 确认

文章插图
如果想通过代码执行此操作,请参见下文:
//identify the areavar areaActual= {dataOnly: true,references: [{fieldName: "Actual",items: [fieldName]}]};var style = new GC.Spread.Sheets.Style();style.formatter = "$#,##0";//set style to the areapivotTable.setStyle(areaActual, style);我们可以对其他字段使用相同的逻辑 。使用下表对应的格式:
文章插图
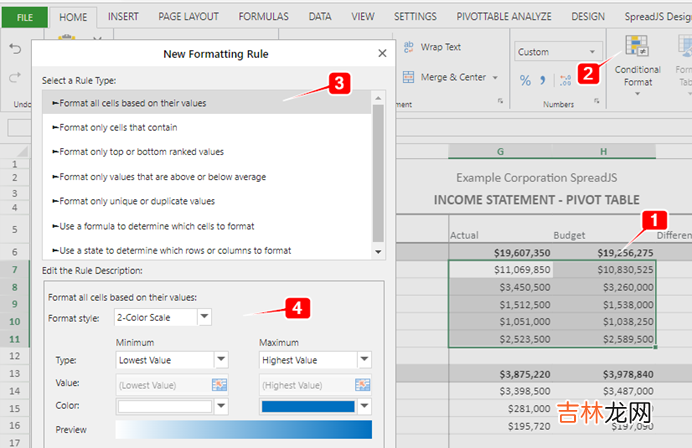
这里推荐使用条件格式,以使查看者更快地查看最大的帐户 。数据透视表提供了为指定维度设置条件规则的能力 。无论数据透视表布局如何变化,条件规则都只遵循指定的维度 。
如果使用设计器,按照以下步骤添加条件格式规则:
- 选择单元格:G7:H11
- 主页 → 条件格式 → 新规则
- 选择“根据单元格的值格式化所有单元格”
- 格式样式:2 色标度(蓝色表示最高值,白色表示最低值)
文章插图
对其他帐户组重复相同的操作,记住使用黄色作为费用和蓝色作为收入 。
生成报告下面是我们制作好的损益表报告截图:

文章插图
以上就是如何使用 SpreadJS 纯前端表格控件,来生成所需的财务报告来支撑企业的财务应用 。
更多纯前端表格在线demo示例 :https://demo.grapecity.com.cn/spreadjs/gc-sjs-samples/index.html纯前端表格应用场景:https://www.grapecity.com.cn/developer/spreadjs#scenarios移动端示例(可扫码体验):http://demo.grapecity.com.cn/spreadjs/mobilesample/
经验总结扩展阅读


- 怎么样发朋友圈只发文字(怎样发纯文字的朋友圈)
- 纯大米粉能做什么吃的
- 知识图谱实体对齐2:基于GNN嵌入的方法
- 家用自来水是纯净水吗
- 纯碱是危险品吗
- 纯净水不导电是真的吗?
- 纯酸奶太难吃了怎么弄
- 15 基于SqlSugar的开发框架循序渐进介绍-- 整合代码生成工具进行前端界面的生成
- Java一次返回中国所有省市区三级树形级联+前端vue展示【200ms内】
- 纯牛奶跟鲜牛奶有什么区别